Automate GitHub Login Using SSH (On Windows)

This article is minimal guide about how to set up Git SSH configuration, on a Windows environment, in order to be able to interact with Git without authenticating every time, which is especially useful when you have to automate some process.

Requirements

  • Git Desktop
  • Basic Knowledge of Git and GitHub

Steps

  • Generate and Register SSH Keys
    • Generate Public and Private Key
    • Register the Public Key (on GitHub)
  • Test the Connection
  • Configure Repository Remotes
  • Additional SSH Configurations (optional)
    • Different Key File Path/Name
    • Host Specific Keys
    • Auto-Launching the ssh-agent (should run by default)
  • Security Considerations

As you will see, even in the windows environment Git Desktop installs also the linux bash, some commands and scripts in this article will use bash commands (directly stolen from the Git docs)

Generate and Register SSH Keys

Run the Git Bash from a computer in which you have already configured your GitHub user.
If it has not been configured it yet, follow the Git docs and configure it:
Configure Git User
Configure GitHub User

Generate Public and Private Key

Run the following command:

ssh-keygen

it will ask you for:

  • File Path – keep the default one ({CurrentUserFolder}/.ssh/id_rsa), more about this later.
  • Passphrase – this is a password to protect the file, it will be asked every time you use the file or once for the session (until you log-off or turn off the system). If the process must be completely automatic leave it empty.

This should be the output of the command:

gluisotto@QDLP03 MINGW64 ~/Desktop
$ ssh-keygen
Generating public/private rsa key pair.
Enter file in which to save the key (/c/Users/gluisotto/.ssh/id_rsa):
Enter passphrase (empty for no passphrase):
Enter same passphrase again:
Your identification has been saved in /c/Users/gluisotto/.ssh/id_rsa.
Your public key has been saved in /c/Users/gluisotto/.ssh/id_rsa.pub.
The key fingerprint is:
SHA256:QVbZyfHnyEZtEqvMiddrQrHzX9aFPdRbLUouT/mJBLk gluisotto@QDLP03
The key's randomart image is:
+---[RSA 3072]----+
|        o..+.o.  |
|       o  ..+. +o|
|        . o o *.B|
|         . O @.Xo|
|        S E / *o+|
|           B * o+|
|            + * +|
|             o o.|
|                .|
+----[SHA256]-----+

Now navigate to your user folder C:\Users\{user}\.ssh.
You should contain two files:
– id_rsa – the private key, keep it safe
– id_rsa.public – the public key, the one that will be distributed

Register the Public Key

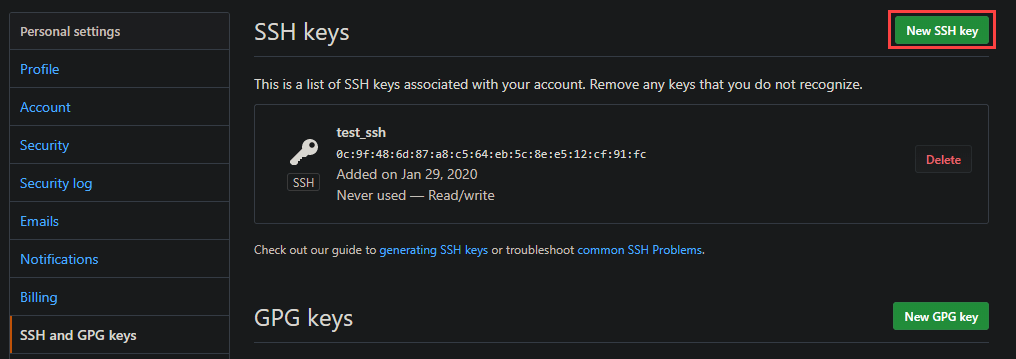
To register the public key on GitHub, open your profile settings and look for “SSH and GPG Keys”, or use this link https://github.com/settings/keys.

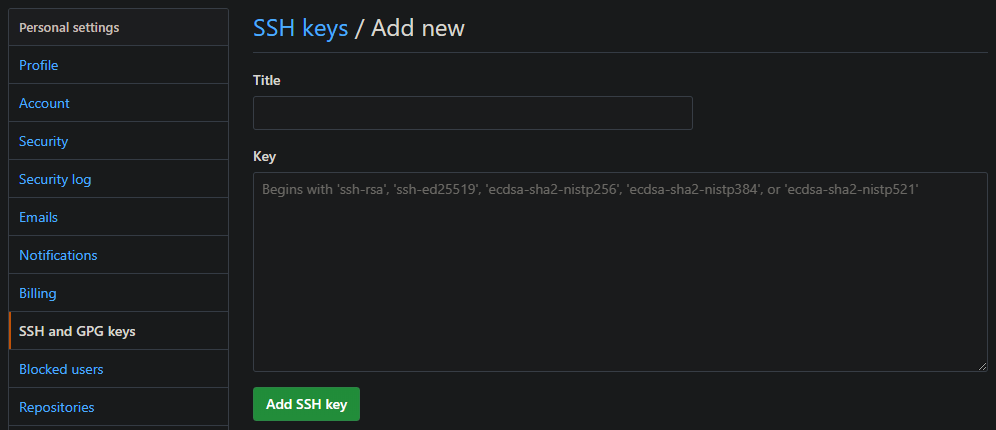
Here we can add a new SSH key.
Copy the content of your Public Key file (id_rsa.public) in the value and assign it a name. When you add a key GitHub will ask for your password even if you are already logged in, you will also receive an email that notifies you that a key has been added.

Test the Connection

To test the connection you just need to run the following command

ssh -T git@github.com

# Which should answer with the following message
$ ssh -T git@github.com
Hi Trovalo! You've successfully authenticated, but GitHub does not provide shell access.

# To check why it works (or doesn't) run
ssh -Tvv git@github.com

#This will output what's happening, below a small section of the whole output:
debug1: Will attempt key: /c/Users/gluisotto/.ssh/id_rsa
debug1: Will attempt key: /c/Users/gluisotto/.ssh/id_dsa
debug1: Will attempt key: /c/Users/gluisotto/.ssh/id_ecdsa
debug1: Will attempt key: /c/Users/gluisotto/.ssh/id_ed25519
debug1: Will attempt key: /c/Users/gluisotto/.ssh/id_xmss

As you might have noticed, the command by default looks for the id_rsa file in the user folder, so by keeping the default settings the setup is already finished.
If you want to change the file path or name you will have to write/edit a configuration file.

Configure Repository Remotes

In order to use the previously SSH authentication, you must interact with the repository using SSH.
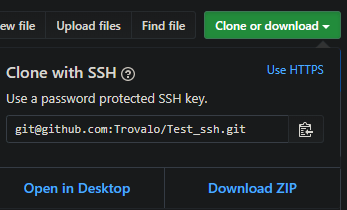
When you clone a repository, the proposed way is http, but you can change in to SSH

You can check the current repository configuration by navigating to its folder and running

git remote -v

# Sample Output
gluisotto@QDLP03 MINGW64 /c/Projects/git/Test_ssh (master)
$ git remote -v
origin  https://github.com/Trovalo/Test_ssh (fetch)
origin  https://github.com/Trovalo/Test_ssh (push)

When using HTTP, the configured SSH key won’t be used, if you try to push to the repo, Git will ask you to authenticate to GitHub.

To change the remote from HTTP to SSH you can run the following command (git docs here)

git remote set-url origin git@github.com:Trovalo/Test_ssh.git

# Sample Output
gluisotto@QDLP03 MINGW64 /c/Projects/git/Test_ssh (master)
$ git remote set-url origin git@github.com:Trovalo/Test_ssh.git

gluisotto@QDLP03 MINGW64 /c/Projects/git/Test_ssh (master)
$ git remote -v
origin  git@github.com:Trovalo/Test_ssh.git (fetch)
origin  git@github.com:Trovalo/Test_ssh.git (push)

Now Git won’t ask you to authenticate to GitHub, it will do that automatically through the SSH key.

Additional SSH Configurations

Behind the SSH configuration there is a whole world of configuration files, I will list only few settings that I found useful for me while exploring this world.

As you have seen previously, when Git connects using SSH, it will look for some default folders and file.
Those files can be seen in the result of the command

ssh -Tvv git@github.com

# In the output you can see:
debug1: Reading configuration data /etc/ssh/ssh_config
{...}
debug1: Will attempt key: /c/Users/gluisotto/.ssh/id_rsa
debug1: Will attempt key: /c/Users/gluisotto/.ssh/id_dsa
debug1: Will attempt key: /c/Users/gluisotto/.ssh/id_ecdsa
debug1: Will attempt key: /c/Users/gluisotto/.ssh/id_ed25519
debug1: Will attempt key: /c/Users/gluisotto/.ssh/id_xmss
{...}
debug1: Trying private key: /c/Users/gluisotto/.ssh/id_rsa
{...}

This is a linux command of OpenSSH (more info in the official page), and as you can see also the path of some folder il linux like i.e. the “etc” folder.
The OpenSSH related folder are in the Git install directory, which by default on windows is: “C:\Program Files\Git\etc\ssh”, here you will find the configuration files.

The two main configuration files are (create them if missing):
– User Configuration – C:\Users\{user}\.ssh\config
– Global Configuration – C:\Program Files\Git\etc\ssh\ssh_config

Different Key File Path/Name

In order to load keys with non default names, you can add some lines to a config file

# this applies to all  the hosts
Host *
  AddKeysToAgent yes
  IdentityFile ~/.ssh/id_rsa
  IdentityFile ~/.ssh/id_rsa_test

You can configure this in two different files (create them if they don’t exists)
– User Configuration – C:\Users\gluisotto\.ssh\config
– Global Configuration – C:\Program Files\Git\etc\ssh\ssh_config

I’ve added those settings to the global file, now when you test the connection the ssh agent will look for the two specified files “id_rsa” and “id_rsa_test”

ssh -Tvv git@github.com

# In the output you can see:
debug1: Reading configuration data /etc/ssh/ssh_config
debug1: /etc/ssh/ssh_config line 49: Applying options for *
{...}
debug1: identity file /c/Users/gluisotto/.ssh/id_rsa type -1
debug1: identity file /c/Users/gluisotto/.ssh/id_rsa-cert type -1
debug1: identity file /c/Users/gluisotto/.ssh/id_rsa_test type -1
debug1: identity file /c/Users/gluisotto/.ssh/id_rsa_test-cert type -1
{...}

Host Specific Keys

If you have multiple SSH connection with different keys, you can specify which key must be used for each host.
To specify this you must add something like the following to one of the configuration files (Global or user file)

Host github.com
  IdentityFile ~/.ssh/id_rsa_github
  {other options}

Host AnotherHost
  IdentityFile ~/.ssh/id_rsa_AnotherHost

Auto-Launching the ssh-agent

The ssh-agent should start when the Git-Desktop is started, if it doesn’t start you should receive an error message while trying to log-in. This is because the SSH keys have not been loaded.
you can manually load an SSH key with the command

ssh-add {path_to_key_file}

If the ssh agent is not in execution when you execute Git, there is a workaround to start it, provided directly by GitHub.
In practice when Git is started it also launches a script, that checks if the ssh-agent is running, and if it isn’t then it starts it.
This is the link to the Github documentation:
https://help.github.com/en/github/authenticating-to-github/working-with-ssh-key-passphrases#auto-launching-ssh-agent-on-git-for-windows

Security Considerations

I’m not an expert of security, so I will tell you only why you should keep your keys safe and then link some useful and way more comprehensive resources about SSH keys management.

If someone has access to your pc, they will also have access to your keys, and therefore are able to log-in in this case in GitHub with your user.
In case the key file is compromised, delete the public key from GitHub, this will make it useless, but you will have to create and register the new key, and also configure all the client in which it was used.

Here are some useful resources about SSH key management:

How to use Input Parameters in Power BI

If you ever had the need to create a Power BI report that asks for some input before loading and takes different choices based on the provided input, then look no further.

In this article you will see and learn how to:

  • Configure Parameters
  • Edit/Write M Code (Power Query) to take different actions based on the parameters
  • Create a Power BI template

The final result will be a report that loads data from two different data sources, one mandatory and one optional, both configurable when the report is opened.
In my sample I will use a SQL Server database as datasource but the same can be applied to any datasource.

Prerequisites

  • Power BI Desktop (download)
  • Knowledge of Power BI report development – basic concepts will be given as granted
  • Basic understanding of the M language (Power Query) – you don’t need to know how to write it manually, just how to generate and read it.

Configure Parameters

Start Power BI Desktop, create a new file and open Power Query (Edit Queries).
In the top bar select: Home -> Manage Parameters.
The following window will allow us to create and edit our parameters.

For each parameter you will be able to specify the following properties:

  • Name
  • Description – It will be visible as a tooltip (if not empty)
  • Required – A checkbox that specify if a parameter is mandatory or not (required and optional parameters have no graphic difference in the input form)
  • Type – The data type of the parameter
  • Suggested Value
    • Any – Free input value
    • List of Values – A manually defined list of possible values
    • Query – use a previously defined “list query” to show the possible values
  • Current Value – specify the current value, if the parameter is required you must provide one now

In my example I will use a SQL Server database as datasource, so my parameters will refer to the needed data to open a connection.
I suggest you to populate all the parameters since you will need them to choose

NameDescriptionRequiredTypeSuggested ValueCurrent Value
Server\Instance 1RequiredTrueTextAny valueSQLCSRV04\SQL2017
Database 1RequiredTrueTextAny valueSqlWorkload_Sample1
Server\Instance 2OptionalFalseTextAny valueSQLCSRV04\SQL2017
Database 2OptionalFalseTextAny valueSqlWorkload_Sample2

Note: since there is no graphical difference between Required and optional I usually specify that in the description

Edit/Write M Code

Using Parameters

We can now import some data, since some parameters already exists the menu allows us to choose a parameter as value

In this databases i have two different sets of data about windows performance counters (with the same structure), so I’ve created two queries

  • Source1_WinPerfCounters – with connection based on the “* 1” parameters
  • Source2_WinPerfCounters – with connection based on the “* 2” parameters

By using the advanced editor (Home -> Advanced Editor) we can see the whole query code, which for me is:

let
    Source = Sql.Database(#"Server\Instance 1", #"Database  1"),
    baseline_PowerBI_WinPerfCounters = Source{[Schema="baseline",Item="PowerBI_WinPerfCounters"]}[Data]
in
    baseline_PowerBI_WinPerfCounters

As you can see parameters are referenced using #”<ParamName>”.
The auto-generated code used them in the “Source” step, but you can use them wherever you want by editing the code manually.

Create two additional parameters

NameDescriptionRequiredTypeSuggested ValueCurrent Value
Source 1 LabelOptional – if empty “Source 1”FalseTextAny valueProduction
Source 2 LabelOptional – if empty “Source 2”FalseTextAny value

Now create a new column “Source” on both tables (Add-Column -> Custom Column).
In the formula bar you can type “#”, it will suggest you the parameters

Since we want a default value if the parameter has no value this is the formula

-- Source 1 table
if#"Source 1 Label" <> null then #"Source 1 Label" else "Source 1"
-- Source 2 table
if#"Source 2 Label" <> null then #"Source 2 Label" else "Source 2"

The final result in the advanced editor will be like this:

let
    Source = Sql.Database(#"Server\Instance 1", #"Database  1"),
    baseline_PowerBI_WinPerfCounters = Source{[Schema="baseline",Item="PowerBI_WinPerfCounters"]}[Data],
    #"Added Custom" = Table.AddColumn(baseline_PowerBI_WinPerfCounters, "Source", each if #"Source 1 Label" <> null then #"Source 1 Label" else "Source 1")
in
    #"Added Custom"

Conditional Data Load

If we try to run the current code without specifying the second data source we will get an error, in fact the query will run with null parameters and cause an exception.
We will now add a check on the parameter value and load the table only if a value has been provided.

To avoid breaking any front-end dependency (like measures, calculated fields, etc) or back-end (queries that reference this table, like an union or join), we will load it if the parameter exists, otherwise we will load an empty table.
This empty table can be defined in M, but since I have a table with the same structure that is mandatory i will just reference it an load 0 rows, thus copying oly his structure.

No edits are made to the first source just because it is mandatory.

The current “Source2_WinPerfCounters” code

let
    Source = Sql.Database(#"Server\Instance 2", #"Database  2"),
    replay_PowerBI_WinPerfCounters = Source{[Schema="replay",Item="PowerBI_WinPerfCounters"]}[Data],
    #"Added Custom" = Table.AddColumn(replay_PowerBI_WinPerfCounters, "Source", each if#"Source 2 Label" <> null then #"Source 2 Label" else "Source 2")
in
    #"Added Custom"

The new “Source2_WinPerfCounters” code

let

    //Queries
    #"ParamProvided" =
    let
        Source = Sql.Database(#"Server\Instance 2", #"Database  2"),
        replay_PowerBI_WinPerfCounters = Source{[Schema="replay",Item="PowerBI_WinPerfCounters"]}[Data],
        #"Added Custom" = Table.AddColumn(replay_PowerBI_WinPerfCounters, "Source", each if#"Source 2 Label" <> null then #"Source 2 Label" else "Source 2")
    in
        #"Added Custom",

    #"ParamMissing" =
    let
        //Keep 0 rows from other (mandatory) table | copy structure of table without data
        EmptyTable = Table.FirstN(#"Source1_WinPerfCounters",0)
    in
        EmptyTable,


    //Choose execution path
    #"Result" = if #"Server\Instance 2" = null
        then #"ParamMissing"
        else #"ParamProvided"
in
    #"Result"

This code defines two variables, “ParamProvided” and “ParamMissing”, each one contains a whole query, the “Result” step then decides which one will be used to load the data.

now, if you change the “Server\Instance 2” parameter (which is the one used in the if) you can already preview the result

With Parameter Value
Without Parameter Value

Last Adjustments

Just to have a better model I will now union (append) the two tables into one, which will always work since even if the second table has not been provided, it exists as an empty table.

  • Create “WinPerfCounters” – result of the union (append) of “Source1_WinPerfCounters” and “Source2_WinPerfCounters”
  • Disable “Enable Load” in the two source table

To put some order in the Power Query structure I will also create some groups, to categorize parameters and tables

Another important thing to remember is the order of the parameters, the report itself won’t show us the input parameter form, but the template will.
In this form, the parameters will have the same order as in Power Query, so you may want to rearrange some of them to show them in a meaningful order. (just drag and drop them to change the order).
Below the final result:

As the last step we will create a basic front-end, in order to have something to show.
In my case a simple line-chart will do.

Create a Power BI Template

So far we have just created a report that uses parameters. It won’t show us a form to input the values and if we want to do so we will need to open Power Query.

What we need is a Power BI template, which contains the back-end and front-end definition, but once opened will ask us the input parameters.

To create a template simply save the current report file in template (.pbit) format.
File -> Save As -> Type “power bi template files”

Save As

While saving it will also ask you for a description, it will be shown on the top of the parameters form. (be aware that this description can’t use new line and other chars)

Now that you have the template file, open it with Power BI Desktop, the first thing you will see is the parameter form.

Note that only one source has been populated

After the data load you will have an unsaved Power BI report, which can be saved for further usage. if you want a new file simply start the template again

I hope you found this post useful, below the links to the repository with the created files:
Github

Configure and Run Kapacitor (On Windows)

In this post we will see how to configure and run Kapacitor, which is the last component of the TICK stack.

  • A Brief Introduction
  • Download Kapacitor
  • Configure and Run Kapacitor (as a Service)
  • Using Kapacitor in Chronograf
    • Add a Kapacitor Connection
    • Add Handlers
    • Create an Alert Task

A Brief Introduction

Kapacitor is a data processing engine for InfluxDB, which can process streaming and batch data.
Kapacitor has his own programming language, the TICK Script, that’s used to create rules and manage actions. i.e. you can create a rule that does the following:

if the metric <x> is over the threshold <y> for <n> seconds then we are at <warning|critical> level, <do something> and send an alert to <handler|topic>

Kapacitor can interact with other systems using User Defined Functions, and offer built in outputs like SMTP, log files, http post, Slack, Telegram and lots of other services.
The alerts can be managed in two ways:

  • Push to handler – that means “send the alert via <handler (SMTP and others)>”
  • Publish and subscribe – which means that the alerts are sent to one or more “topic” and then the handlers can subscribe to that topic.

Download Kapacitor

Kapacitor can be downloaded from the InfluxData website at the following link: https://portal.influxdata.com/downloads/
In this guide, I will use Kapacitor version 1.5.3 which is the current stable version.

I will extract the files to a folder called “kapacitor”, this should be the content of the zip

kapacitor
    kapacitor.conf
    kapacitor.exe
    kapacitord.exe
    tickfmt.exe

Configure and Run Kapacitor (as a Service)

As every other component of the TICK stack capacitor runs with a configuration file, a documented sample files comes with the downloaded archive.
The full documentation can be found here.
To create a new one run the following command:

.\kapacitord.exe config > kapacitor_custom.conf

Important Note: if you create the file using Powershell (as I do), Kapacitor won’t be able to parse the file because it’s encoded in UTF-16. Ensure that the conf File is encoded in UTF-8 (Without BOM).

Configuration Settings

The most important configurations are the following:

# Multiple InfluxDB configurations can be defined. Each one will be given a name and can be referenced in queries
# only one must be marked as default
# if authentication is enabled you must provide username and password
# the provided user must be an admin to be able to create the kapacitor database
# if the database exists then the user needs read and write permission
[[influxdb]]
  enabled = true
  name = "localhost"
  default = true
  urls = ["http://localhost:8086"]
  username = "InfluxdbAdmin"
  password = "password"
  # Subscription mode is either "cluster" or "server"
  subscription-mode = "server"
  subscription-protocol = "http"
  # How often kapacitor will look and subscribe to newly created databases
  subscriptions-sync-interval = "1m0s"
  
  # Database and retention to exclude from subscription, format: db_name = <list of retention policies>
  # by default the kapacitor db is excluded, see [stats] section
  [influxdb.excluded-subscriptions]
    _kapacitor = ["autogen"]

# send kapacitor statistics (i.e. alert messages) to the following influx database
[stats]
  enabled = true
  stats-interval = "10s"
  database = "_kapacitor"
  retention-policy= "autogen"

Note: configuration values might be passed using environment variables like KAPACITOR_INFLUXDB_0_USERNAME=”user” and KAPACITOR_INFLUXDB_0_PASSWORD=”pw”

Other useful configuration settings are

# Kapacitor meta files location, the created conf file defaults to the user directory i.e. C:\\Users\\gluisotto\\.kapacitor
# I will put all the files in the "files" subdirectory
data_dir = "C:\\Projects\\monitoring_sample\\kapacitor\\files"

# all the other files will be written in the same subfolder
[replay]
  dir = "C:\\Projects\\monitoring_sample\\kapacitor\\files\\replay"

[storage]
  boltdb = "C:\\Projects\\monitoring_sample\\kapacitor\\files\\kapacitor.db"

# The task section is deprecated, use [load] instead
# [task]

# On startup load the tick scripts in this folder
[load]
  enabled = true
  dir = "C:\\Projects\\monitoring_sample\\kapacitor\\files\\load"


# Logging configuration, i will keep STDOUT here and write a rotated log file using nssm
[logging]
  # Can be a path to a file or 'STDOUT', 'STDERR'.
  file = "STDOUT"
  # Logging level can be one of: DEBUG, INFO, WARN, ERROR, or OFF
  level = "INFO"

Run Kapacitor as a Service

Now test the configuration file by running kapacitor, any error will be visible in the console

.\kapacitord.exe -config .\kapacitor_custom.conf

If everything is working properly we can set up the service using nssm.
The process il always the same, start powershell (as admin) and execute nssm:

.\nssm.exe install

And configure the service as you wish.
Note: The arguments parameter must contain the absolute path to the .conf file

I will manage the logging through nssm, which can rotate files (folder and file should be created beforehand).

Restrict Log Rotation = 604800 sec keeps 7 days of logs (7*24*60*60)

Install the service, now you should see it in “services”.
Start it, errors will be visible in the log file, service linked errors will be visible in event viewer.

Using Kapacitor in Chronograf

Capacitor has already subscribed to our InfluxDB instance and can be used through the command line (basic sample here) or from Chronograf (docs here).
In this guide I will use Chronograf, which offers an UI to manage and use Kapacitor.
Be warned that some tasks can’t be performed from the UI (like configure complex rules and other management tasks).

Add a Kapacitor Connection

The first step is to start Chronograf if it’s not already running.
Once started go in the “configuration” section and add a Kapacitor connection.

A wizard will allow you to set up the connection, use the credentials of the InfluxDB instance.

Configure Handlers

Handlers can be configured through Chronograf or from the Kapacitor conf file.
To add an Handler clock on the created Kapacitor connection and edit it.

From this menu you will be able to change credentials, configure, test and enable or disable handlers, i.e. SMTP.
Some handler do not require pre-configuration, i.e. logging to a file can be configured directly in the alert rule.

Create an Alert Task

From the main page of Chronograf go to “Alerting” and select “Manage Tasks”.
From here you can create new tasks in two ways:

  • Build Alert Rule – this will create a rule through the UI. which will be converted to a TICK script
  • Write TICKscript – manually write a TICK script

Select “Build Alert Rule”, I will use Windows CPU data in my alert, which is configured as follows:

  • Type: Threshold
  • Groped by Tag: Host
  • Field: mean of CPU Idle Time %
  • Threshold: >= 90

Note: I use the “Idle time” so I’m sure that the rule will be triggered

I will write the alerts to a log file but you can add as many handlers as you want (or even none). Mind the double backslash in the path.

The last step is to configure the alert message. The interface will provide some template variables, more options are available if you write the script manually.
Below the message formula:

{{.Level}} - CPU Idle Time is {{ index .Fields "value" }} on {{ index .Tags "host" }}
# note that the field key/name is "value" because that's the default alias (visible in TICKscript)

Now you can save and activate the rule.
In the “Alerting” section you will see the alert rule and it’s corresponding TICK script (which can be opened and edited).
You will see that most of what we have configured is managed through variables.
For more info about TICKscript synthax have a look at the docs

{...}
var message = '{{.Level}} - CPU Idle Time is {{ index .Fields "value" }} on {{ index .Tags "host" }}'

var idTag = 'alertID'

var levelTag = 'level'

var messageField = 'message'

var durationField = 'duration'

var outputDB = 'chronograf'

var outputRP = 'autogen'
{...}

The alert data will also be written in InfluxDB, by default the output db is called “chronograf” and the Retention Policy “Autogen”.

If the rule is running and the alert condition is met you should see at least one entry in “Alert History”, which shows us few information about the alert

To see the whole message we check the log file, or query the data in InfluxDB from Chronograf, use the following query to get all the data about your alert. (use the table visualization otherwise Chronograf won’t be able to show it)

SELECT * FROM "chronograf"."autogen"."alerts" WHERE alertName = 'My Test Rule'

Note: the log file data are in Json format, the strings are encoded to be valid html.

Alert Summary

  • Gets triggered when the idle CPU is over 90%
  • The “group by Host” tells Kapacitor to send an alert for each Host that reaches the threshold, you don’t need a rule for each monitored machine, you just need to group by
  • Writes a db entry when it gets triggered (critical level) and when the value gets back to a safe level (OK level)
  • Alert data can be sent to handlers (in this case log) and queried on the Influx database

The End

Now you should know how to configure and run Kronograf and also have an idea about what an alert rule looks like.
I hope you found this guide simple and useful.

Configure and Run Grafana (On Windows)

In this guide we will se how to

  • A Brief Introduction
  • Download Grafana
  • Configure Grafana
  • Run Grafana (as a Service)
  • Access Grafana

A Brief Introduction

Grafana is an open-source platform for monitoring that allows to query, visualize and create alerts from data stored in lots of different sources.
Its main components are dashboards, which can be created from scratch or imported, there are lots of official and community-made dashboards ready to use, visit grafana dashboards and have a look at them.
Grafana can run on any platform, Windows, Linux, Docker and Mac.

Download Grafana

To download Grafana follow this link, you will have two options, download the installer or download the standalone binaries.
I will use the standalone binaries.

Once downloaded extract the archive into the desired folder, I will extract it in a folder called “grafana”.

Configure Grafana

It is important to put all the custom configuration in a separate file and not in the default one. The default configuration file “defaults.ini” can be found in the subfolder “conf”.
make a copy of this file and call it “custom.ini”.
The custom configuration will override the default one, Grafana will automatically read the file called “custom.ini”

Edit “custom.ini” and change the http port to 8080 or any other non reserved/occupied value.

# The http port to use
http_port = 8080

The default configuration of Grafana is really nice and you don’t need to change anything else, the log is already written to a rotated file and the basic authentication is already active.
Grafana supports other authentication methods and lots of other configurations (i.e SMTP configuration), you can find all in the docs.

Run Grafana (as a Service)

To run Grafana you just need to execute “grafana-server.exe”.
important: Grafana will create his folder relatively to the working directory, once started it will output the path to the created folders

.\grafana-server.exe

# example of folder path returned once Grafana is running
[32mINFO[0m[11-18|16:13:22] Path Home                                [32mlogger[0m=settings [32mpath[0m=C:\\Projects\\monitoring_sample\\grafana
[32mINFO[0m[11-18|16:13:22] Path Data                                [32mlogger[0m=settings [32mpath[0m=C:\\Projects\\monitoring_sample\\grafana\\data
[32mINFO[0m[11-18|16:13:22] Path Logs                                [32mlogger[0m=settings [32mpath[0m=C:\\Projects\\monitoring_sample\\grafana\\data\\log

To run it as a service use nssm and configure the service

.\nssm.exe install

You can now find “Grafana service” in windows services and run it.
If the startup directory is the subfolder “bin”, Grafana will create the following folders and files:

data
│   grafana.db
│
├───log
│       grafana.log
│
├───plugins
└───png

Access Grafana

To access Grafana head to the configured url, for me http://localhost:8080/login, if you are not sure about the port you can find it in the configuration file or in the log file.

The default user is “admin” with password “admin”, after logging in Grafana will ask you to change that password.

The End

Now Grafana is up and running, I hope you found this guide useful

Run and Use Chronograf (on Windows)

In the previous posts we have installed an InfluxDB instance and started gathering data with Telegraf, now we want to explore and query those data.

  • A Brief Introduction
  • Download Chronograf
  • Run Chronograf
  • Chronograf UI Overview
    • InfluxDB Schema vs SQL DB Schema
  • Authentication
  • Run Chronograf as a Service

A Brief Introduction

To query the data you can use the InfluxQL or Flux languages through the cli or http but there is a better way to explore your data, Chronograf

Chronograf is the GUI of the TICK stack, it allows you to manage InfluxDB and Kapacitor, it cannot do everything, for some tasks you still need to write some code but it helps a lot, especially for data exploration, as it allows you to query and visualize the result through charts.

Download Chronograf

As every other component of the TICK stack you can download Chronograf at the following link, the current stable version is 1.7.14

Download the Windows binaries and move them to another folder, I will create a “chronograf” folder in the same directory as the previously installed TICK stack components.
The folder should contain two files

monitoring_sample
├───chronograf
│       chronoctl.exe
│       chronograf.exe

Run Chronograf

Chronograf does not have a configuration file, if you need to change something you need to use the command line options, I will use the default configuration.
To run Chronograf just execute “chronograf.exe”

# you should see something similar in the console that runs Chronograf
time="2019-11-18T10:24:18+01:00" level=info msg="Running migration 59b0cda4fc7909ff84ee5c4f9cb4b655b6a26620"
time="2019-11-18T10:24:18+01:00" level=info msg="Serving chronograf at http://[::]:8888" component=server
time="2019-11-18T10:24:18+01:00" level=info msg="Reporting usage stats" component=usage freq=24h reporting_addr="https://usage.influxdata.com" stats="os,arch,version,cluster_id,uptime"

By default Chronograf will listen on port 8888 from any host, so head to http://localhost:8888/ and be welcomed by a series of pages, which guide you in the configuration.

Configure the connection to InfluxDB, connect with an administrator user to be able to perform administration tasks (i.e. create databases, users, etc).

Chronograf embeds some predefined monitoring dashboards (also called “canned dashboards”), he will propose you dashboards according to the data stored in the instance.

Kapacitor is the last component of the TICK stack, used to create and manage alerts, since we don’t have a Kapacitor instance yet we will skip this part.

It’s done, Chronograf is up and running

Chronograf UI Overview

We will now see the main section of Chronograf regarding InfluxDB, some pages are strictly related to Kapacitor, which is not yet installed.

This should be the first page you see, from the “Configuration” page you can create new connections to other InfluxDB instances and link Kapacitor to those instances.

From the “InfluxDB Admin” page you can manage databases and users (create, drop, edit, manage permissions, etc). You can also view running queries.

In the “Dashboards” page you can manage, view, create or import dashboards, each dashboard is a json file.

In the “Host List” page you have an overview of all the monitored hosts, with some metrics and link and to the “canned dashboards” (if installed).

At last the best part of Chronograf (at least IMO), the “Explore” page.

From this page you can query and visualize your data in charts, any created visualization can be saved to a dashboard.
Below an example:

In the “Queries” section you can write a query, by hand or through the UI.
In order to create a valid query you must select at least:

  • Database and Retention Policy – you can have more retention policies per db
  • Measurement
  • Tag – (optional) you can filter and/or group by the result by tag
  • Field – with an aggregation function

The above chart uses the following query

SELECT mean("Percent_User_Time") AS "mean_Percent_User_Time" FROM "windows_system_monitor"."autogen"."win_cpu" WHERE time > :dashboardTime: AND "host"='QDLP03' GROUP BY time(:interval:) FILL(null)

As you can see the result is grouped by “time(:interval:)”, which is a variable (called template variable), that can be set in the top right corner, by default it should be “1h”, so we see the last hour of data.

On the other section, “Visualization“, we can chose the visualization type and several formatting options (title, colors, axis, etc)

From the “Queries” section is also possible to use the “metaquery template”, which allows you to explore the influx schema.

InfluxDB Schema vs SQL DB Schema

You might be wondering what measures, tag and fields are, here you can find the full documentation, I will make only a basic summary of the main entities.

Influx DB entitySQL DB entity
MeasurementsTables
TagsColumns (indexed)
FieldsColumns (not indexed)
PointsRows

It is important to understand the difference between Tags and Fields.

  • Tags are indexed, and are used to filter and aggregate data, they provide the context for in which Fields are analyzed (i.e. view CPU usage (the Field) by host or for a specific core (the context)
  • Fields are not indexed and should only be aggregated, a field should represent a metric. (i.e. CPU usage)

Authentication

As you might have noticed Chronograf by default does not ask for any username or password and therefore anyone can enter.
In this guide I won’t setup any authentication, but it is recommended to do so in any meaningful environment.
Chronograf uses Oauth 2.0, the configuration differs for each authentication provider, the full documentation can be found here.

Run Chronograf as a Service

To run Chronograf as a service we will use nssm, the setup is really simple.
Run the following command (run as admin):

.\nssm.exe install

Then configure the service

Note that I have also configured the logging, as you may have noticed all the activity performed on chronograf is sent to the console, through nssm the output is redirected to the log file.
For the log file I have created the subfolder “log” within the “chronograf” directory.
After installing the service you should find it in Windows services.
note: if you run chronograf as a specific domain user ensure that it has the rights to write the file

The End

Now you have Chronograf up and running, in one of the next post we will see another tool to create dashboards, Grafana, which is not part of the TICK stack but offers a nice set of feature regarding data visualization.

Configure and Run Telegraf (on Windows)

In this guide we will see how to configure Telegraf to gather data and write them to InfluxDB.
You can have a look at the previous post to set up InfluxDB

  • A Brief Introduction
  • Download Telegraf
  • Configure and Test Telegraf
    • Create Database and User in InfluxDB
  • Run Telegraf as a Service
    • Check the Data

A Brief Introduction

Telegraf is a data collection agent, it’s structured in plugins for input, process, aggregation and output of data.
It comes with over 250 input and around 30 outputs plugins, each one to read and write to specific sources (including generic ones, like files or scripts), all you need to do is write a configuration file.

Telegraf is an open-source project, if something is missing or bugged you can have a look at the project on GitHub and contribute to it yourself.
Telegraf is available for Windows, Linux and Mac OS X.

Download Telegraf

Telegraf can be downloaded from the InfluxData website at the following link:
https://portal.influxdata.com/downloads/
At the time of writing the version is 1.12.5

After downloading the zipped binaries, extract them to a folder, I will call it “telegraf”, the folder should contain only two files:

telegraf
  |  telegraf.conf
  |  telegraf.exe

Configure and Test Telegraf

In order to get Telegraf working we need to create a configuration file, it comes with a default one which has the Windows Performance Counters as input and InfluxDB as output.

The configuration files can be generated by the Telegraf executable by running the following commands using PowerShell or cmd

#generate the full configuration and write it to a file
.\telegraf.exe config > telegraf_full.conf

#generate a filtered configuration (like the default one) and write it to a file
.\telegraf.exe --input-filter win_perf_counters --output-filter influxdb config > telegraf_win_perf_counters.conf

Run the second command and open the generated .conf file.
There you will find lots of information about each parameter and the general rules of the conf file. Parameters that use default values may be commented (#) in the conf file.

We will have a look at the main and useful parameters, (I will remove/rewrite some comments in the code samples)

Collection Frequency

[agent]
  ## Default data collection interval for all inputs - it can be overridden by single input
  interval = "10s" 
  ## Rounds collection interval to 'interval', ie interval = 10s always collect on :00, :10, :20 ...
  round_interval = true
  ## Output batch size, how many points (or "rows") are sent in each batch
  metric_batch_size = 1000
  ## Maximum number of unwritten metrics per output. If the limit is reached the oldest data will be lost
  metric_buffer_limit = 10000
  ## Add a random offset (between the given value) to the data collection, used to avoid read spikes
  collection_jitter = "0s"
  ## How often the gathered data are written to the output
  flush_interval = "10s"
  ## Wait a random delay (between the given value) before writing, used to avoid write spikes
  flush_jitter = "0s"

Adjust the values based on your requirements, for this sample i will leave them with the default value

Logging

  ## Log only error level messages.
    quiet = false

  ## Log file name, the empty string means to log to stderr.
    logfile = "C:\\Projects\\monitoring_sample\\telegraf\\log\\telegraf_win_perf_counters.log"
  ## Log rotation rule
    logfile_rotation_interval = "14d"

I want to log all the errors to a log file, and keep 14 days of log.
To successfully write the log the user running Telegraf must have the write permission to the log folder and files.
I will keep the log files in a subfolder called “log”, in a file with the name that recalls his corresponding configuration

telegraf
    │   telegraf.exe
    │   telegraf_win_perf_counters.conf
    │
    └───log
            telegraf_win_perf_counters.log

Telegraf Output and InfluxDB Configuration

The chosen output is InfluxDB and in the telegraf output settings there are several options to set in order to properly configure it.
We will write to the InfluxDB instance created in the previous post.

[[outputs.influxdb]]
  urls = ["http://127.0.0.1:8086"]
  database = "windows_system_monitor"
  skip_database_creation = true
  ## Empty retention_polic will writeto the database default retention policy
  retention_policy = "autogen"
  ## HTTP Basic Auth
  username = "telegraf"
  password = "telegraf"

With the above setting I will write to the local influxDB instance, which is running on port 8086.
If the database user used by Telegraf has the right permissions it can create the database automatically, which is not something I want.
Before running Telegraf we will create a new database in the InfluxDB instance, and a “telegraf” write only user.
Important: the credentials written in the conf file are in clear text, use system variables in serious environment (check the docs)

Configure InfluxDB

The first step is connect to InfluxDB, I will use the cli by running infux.exe, then we will create database and users using InfluxQL.

#Log-In
AUTH

#check if the authentication has been successful
SHOW USERS

#connect to database _internal, to run commands (even create db) you must connect to a DB first
USE _internal

# Create the database "windows_system_monitor"
# With a default retention policy of 30 days, no replication (only used in cluster)
# and shard duration of 1 day, which is a suggested value (details about this are out of scope)
# since non name has been specified for the retention policy it will be called "autogen"
CREATE DATABASE "windows_system_monitor" WITH DURATION 30d REPLICATION 1 SHARD DURATION 1d

# view created db and retention policy
SHOW DATABASES
SHOW RETENTION POLICIES ON windows_system_monitor

# create user
CREATE USER telegraf WITH PASSWORD 'telegraf'
# assign write privilege - available privileges are read | write | all
GRANT WRITE ON windows_system_monitor TO telegraf

# check the created user
SHOW USERS
SHOW GRANTS FOR telegraf

# close connection
EXIT

Now we can go back to the Telegraf configuration and check that the values of the parameters correspond with the created db and user.
For the complete reference of InfluxQL see the docs

Testing the Configuration

It is possible to test the configuration, this will show us what Telegraf will gather and send, but without actually writing to the output.

# run the test
.\telegraf.exe --config .\telegraf_win_perf_counters.conf --test

# this should be the output
2019-11-15T14:01:14Z I! Starting Telegraf 1.12.5
> win_cpu,host=QDLP03,instance=3,objectname=Processor Percent_DPC_Time=0,Percent_Idle_Time=99.06145477294922,Percent_Interrupt_Time=0,Percent_Privileged_Time=1.528722882270813,Percent_Processor_Time=2.161736488342285,Percent_User_Time=0 1573826476000000000
> win_cpu,host=QDLP03,instance=6,objectname=Processor Percent_DPC_Time=0,Percent_Idle_Time=97.84146118164062,Percent_Interrupt_Time=0,Percent_Privileged_Time=0,Percent_Processor_Time=0.6330135464668274,Percent_User_Time=0 1573826476000000000
{... and a lot more ...}

Common Error
Error running agent: Error parsing .\<FileName>.conf, line 1: invalid TOML syntax
This error is caused by the .conf file encoding (in my case Windows creates UTF-16 encoded files), please ensure that the file is saved with the UTF8 encoding and try again

Run Telegraf as a Service

The only thing left is run Telegraf as a service.
To do so you can use our friend nssm, but Telegraf can do this himself with the following command (run as admin required, otherwise the command will fail)
Important:
Run the command from a PowerShell or cmd with as an admin
– use the absolute path to the config file, otherwise you will get error #1067 when starting the service (you can see them in Event Viewer)

telegraf --service install --service-name=telegraf_wpc --service-display-name="Telegraf WinPerfCounters" --config "C:\Projects\monitoring_sample\telegraf\telegraf_win_perf_counters.conf"

The chosen name is not the best one since the same Telegraf service can run several configuration file at once (ancd each file may contain different inputs), but for now this will do.
Now you should find “Telegraf WinPerfCounters” in the windows services

Check the Data

To check if the data collection is going well connect to InfluxDb and run the following commands

SHOW DATABASES

USE windows_system_monitor
# a measurement can be the equivalent of a table in a relational db
SHOW MEASUREMENTS

#you should see this output, that means that the metrics have been written to the db
name: measurements
name
----
win_cpu
win_disk
win_diskio
win_mem
win_net
win_swap
win_system

Full documentation about the schema navigation can be found in the docs

The End

Now Telegraf should be up and running, filling your InfluxDB with Data.
I hope you found this post useful.

Configure and Run InfluxDB (on Windows)

In this guide, we will see how to configure and run InfluxDB, with some brief explanations and minor edits to its configuration

  1. Download InfluxDB
  2. Configure and Run InfluxDB
  3. Run InfluxDB as a Service

Download InfluxDB

InfluxDB can be downloaded from the InfluxData website at the following link: https://portal.influxdata.com/downloads/
In this guide, I will use InfluxDB version 1.7.9 which is the current stable version.

After downloading the zipped windows binaries, extract them in a folder, I will call it “influxdb”. The folder should contain the following files:

influxdb
    │   influx.exe
    │   influxd.exe
    │   influxdb.conf
    │   influx_inspect.exe
    │   influx_stress.exe
    │   influx_tsm.exe

Configure and Run InfluxDB

InfluxDB can be run by executing “influxd.exe”, but first we need to prepare a configuration file and/or set environment variables.
In this guide I won’t use environment variables, more info can be found in the docs.
There should be a file called “influxdb.conf” which contains all the available configuration options with their respective explanations, the documentation can also be found on github.
The same conf file can be generated from the executable without the comments using the following PowerShell command

#output the default conf to the console
.\influxd.exe config

#output the default conf and write it to a file
.\influxd.exe config > influxdb_custom.conf

run the second command and open the created file “influxdb_custom.conf” that should look like the one below (the configuration uses the TOML synthax)

reporting-disabled = false
bind-address = "127.0.0.1:8088"

[meta]
  dir = "C:\\Users\\gluisotto\\.influxdb\\meta"
  retention-autocreate = true
  logging-enabled = true

[data]
  dir = "C:\\Users\\gluisotto\\.influxdb\\data"
  index-version = "inmem"
  wal-dir = "C:\\Users\\gluisotto\\.influxdb\\wal"
  wal-fsync-delay = "0s"
  validate-keys = false
  query-log-enabled = true
  cache-max-memory-size = 1073741824
  cache-snapshot-memory-size = 26214400
  cache-snapshot-write-cold-duration = "10m0s"
  compact-full-write-cold-duration = "4h0m0s"
  {...and a lot more...}

We won’t change a lot of settings, but there are few things that I want to point out about the default configuration here

  1. Files Location – InfluxDB will create all his files and folders in the user directory, in the “.influxdb” hidden folder
  2. Logging – The log is sent to stdout and not written to a file
  3. Authentication – Authentication is disabled

1- Define the Files Location

The first step is to decide where to put our database data, I will create the following folder tree in the same path of the InfluxDB executables

influxdb_files
├───data
├───log
├───meta
└───wal

If you are lazy you can use the following PowerShell commands to create those folders

#set the path in which influxdb are going to be stored
$InfluxPath = <absolute path to influx folder OR Get-Location for the current folder>
$RootFolderName = "influxdb_files"

#[void](<command>) casts the result of the command to void datatype, suppressing its output message
[void](New-Item -ItemType "directory" -Path $InfluxPath -Name $RootFolderName)
[void](New-Item -ItemType "directory" -Path $InfluxPath\$RootFolderName -Name "data")
[void](New-Item -ItemType "directory" -Path $InfluxPath\$RootFolderName -Name "meta")
[void](New-Item -ItemType "directory" -Path $InfluxPath\$RootFolderName -Name "wal")
[void](New-Item -ItemType "directory" -Path $InfluxPath\$RootFolderName -Name "log")

#list directories
dir $InfluxPath\$RootFolderName

then change the following configuration keys and make them point the new folders (mind the double backslash in the path)

[meta]
  dir = "C:\\Projects\\monitoring_sample\\influxdb\\influxdb_files\\meta"

[data]
  dir = "C:\\Projects\\monitoring_sample\\influxdb\\influxdb_files\\data"
  wal-dir = "C:\\Projects\\monitoring_sample\\influxdb\\influxdb_files\\wal"

2- Define Logging Settings

When it comes down to logging influx does not offer a lot of parameters , most of the configuration is down to the settings below

[meta]
  logging-enabled = true

[logging]
  format = "auto"
  level = "info"
  suppress-logo = false

[http]
  log-enabled = true
  access-log-path = ""
  access-log-status-filters = []
  suppress-write-log = false
  write-tracing = false

As you may have noticed the generated default file is missing a key in the [http] section, “access-log-status-filters”, which must be manually added to the configuration.
Below only the edited log settings

[logging]
  format = "logfmt" 
  level = "warn"
  suppress-logo = true

[http]
  access-log-path = "C:\\Projects\\monitoring_sample\\influxdb\\influxdb_files\\log\\influxdb_http.log"
  access-log-status-filters = ["4xx", "5xx"]

With those settings, we achieve two different things

  1. Logging – The log sent to stdout will contain only warnings and errors, will not contain the logo and will be written in “logfmt” format, readable for humans and also machines (it is a single level key value pairs).
    We still need to send this output to a file but we will see it later.
  2. Http – The http activity will be logged to a specific file, but only if the request has received an error response (status 4xx and 5xx). This also prevent the logging of all the write request received by the database.

Check if the configuration file is valid by running InfluxDB with following PowerShell command (under logging you may want to set the key level = info before running the command in order to see some output if everything is ok)

.\influxd.exe -config .\influxdb_custom.conf

If the configuration file is not valid you will receive an error (the output is still sent to the console).

3- Enable Authentication

This one is pretty easy, in fact we need to change only the following key

[http]
  auth-enabled = false

and set it to true

[http]
  auth-enabled = true

In practice, when we first connect to InfluxDB we won’t be able to do any action, except creating an admin user, after that we can log in and work as usual on the influx server.

Run InfluxDB

We can finally run InfluxDB, to do so start Powershell and execute the following command

.\influxd.exe -config .\influxdb_custom.conf

Now that InfluxDB is running we must connect to it, how?
By default it runs on port 8086, but it can be changed in the conf file

[http]
  bind-address = ":8086"
  #the format is {host:port} -> ":8086" means that Influx can be reached by any host on the network on port 8086

We can communicate with InfluxDB using http request but the easiest way is to use the executable “influx.exe”, so open a new PowerShell or cmd window and execute it.

The first thing to do is create a admin user, any other command will return an error.
Execute the following commands to create and log in with the user

--create an admin user
CREATE USER InfluxdbAdmin WITH PASSWORD 'password' WITH ALL PRIVILEGES

--log in (this will ask for user and pw), 
--to know if the AUTH has been successful execute another command
AUTH

--show users
SHOW USERS

For other log in methods have a look at the docs.

Run InfluxDB as a Service

You thought it was over, but not yet, the last step is to run InfluxDB as a Windows service.
To do so we will use another useful tool called “Non Sucking Service Manager” or “nssm”, so head to this page and download it.

from the downloaded zip get the “nssm.exe” executable, I will move it to the root folder of this sample project but it can be placed anywhere. (but consider that you might not be able to move it afterwards).

nssm.exe can be used from the terminal but also offers GUI, we will use the GUI, to open it you need to execute it from PowerShell or cmd (as admin), open a new PowerShell window (as admin) and run the following command

.\nssm.exe install

The below window will open, with several tabs to configure the service

It is important to specify the absolute paths to the files, even in the arguments, not doing so may lead to errors.

Do you remember that the InfluxDB log was sent to stdout?
The good news is that nssm is able to redirect that output to a file and also to rotate it, so you won’t have huge or useless log files.

The first step is to create the log file, you should already have a folder for for the logs, for me it is C:\Projects\monitoring_sample\influxdb\influxdb_files\log here i will create the file “influxdb_service.log”
The user that runs the service must have the permission to write the files, the user can be configured in the “Log On” tab, using a specific AD user will automatically give him the permission to log on as a service. I will let it run with the local system account.

In the nssm configuration set the following

Restrict Log Rotation = 604800 sec keeps 7 days of logs (7*24*60*60)

After clicking “Install Service” you should see your new service in Windows

Start the InfluxDB service and then try to connect to InfluxDB (using influx.exe as you did previously).
In case of errors you can check your log files and the Windows Event Viewer (nssm writes to event viewer)


The End

That’s it, your InfluxDB instance should be up and running
I hope found this guide useful

Introduction to the TICK Stack

Some time ago I’ve been asked to study and set-up a monitoring solution, to keep in check several SQL Server instances.After a bit of searching around the web I found out that one of the most popular solutions is the TICK stack.
The TICK stack is a set of software developed by InfluxData, each letter of the acronym stands for a software:

  1. Telegraf, to gather the data
  2. InfluxDB, to store the data
  3. Chronograf, to explore data and manage the TICK stack
  4. Kapacitor, to monitor and alert

Now a brief overview of each component.

Telegraf

Telegraf is a server agent for the collection of metrics, it comes with more than 250 plugins to collect metrics from a great variety of systems and softwares like Windows performance, SQL Server, Docker and more (check github for the full list).

InfluxDB

InfluxDB is a Time Series Database (TSDB), it has been developed specifically to store time series data and to satisfy high write and read loads.It offers two different query language, InfluxQL which has a SQL like syntax and Flux which is still in development and inspired to javascript.

Chronograf

Chronograf is the UI of the TICK stack, it can be used for several tasks like administer InfluxDB and Kapacitor, create dashboards but the most useful feature to me is the possibility to explore and query the data through the UI (so you don’t have to memorize the names of measurements and tags to query your data).

Kapacitor

Kapacitor is a data processing engine for stream and batch data. It is made to perform check on the data and send alerts through different channels like email, Slack, Telegram and more.The alert rules that can be built are fully customizable and can be very complex, to write those rules a specific scripting language, called TICKscript, in future version of InfluxDB, Flux will be the only scripting language for the whole TICK stack.

Why Should you use it

Maybe you are wondering why should you use it, here are a few reason:

  1. Free
  2. Multi Platform
  3. Open Source

The whole TICK stack is completely free and open source, you can have a look at it on github. Behind it there is an active community which asks, propose and implement new fixes and features.
Another great pro for the TICK stack is it’s multiplatformness, in fact every component is available on:

  • Linux (several distributions)
  • Windows (32 & 64 bit)
  • Mac OS X
  • Docker (official docker containers)

Design a site like this with WordPress.com
Get started