
In this guide we will see how to configure Telegraf to gather data and write them to InfluxDB.
You can have a look at the previous post to set up InfluxDB
- A Brief Introduction
- Download Telegraf
- Configure and Test Telegraf
- Create Database and User in InfluxDB
- Run Telegraf as a Service
- Check the Data
A Brief Introduction
Telegraf is a data collection agent, it’s structured in plugins for input, process, aggregation and output of data.
It comes with over 250 input and around 30 outputs plugins, each one to read and write to specific sources (including generic ones, like files or scripts), all you need to do is write a configuration file.
Telegraf is an open-source project, if something is missing or bugged you can have a look at the project on GitHub and contribute to it yourself.
Telegraf is available for Windows, Linux and Mac OS X.
Download Telegraf
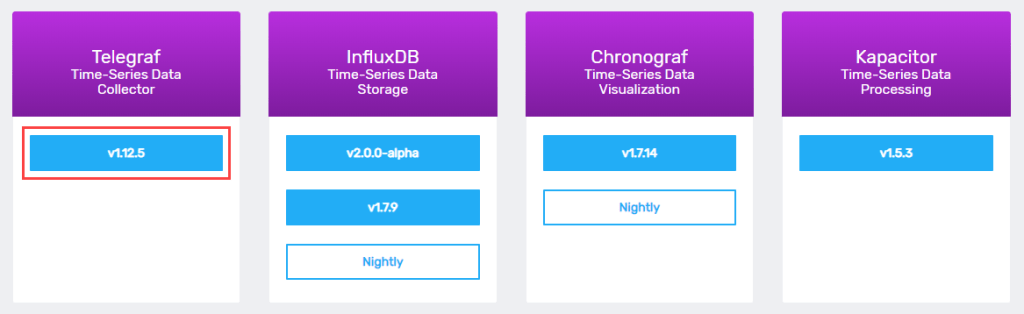
Telegraf can be downloaded from the InfluxData website at the following link:
https://portal.influxdata.com/downloads/
At the time of writing the version is 1.12.5
After downloading the zipped binaries, extract them to a folder, I will call it “telegraf”, the folder should contain only two files:
telegraf
  |  telegraf.conf
  |  telegraf.exe
Configure and Test Telegraf
In order to get Telegraf working we need to create a configuration file, it comes with a default one which has the Windows Performance Counters as input and InfluxDB as output.
The configuration files can be generated by the Telegraf executable by running the following commands using PowerShell or cmd
#generate the full configuration and write it to a file
.\telegraf.exe config > telegraf_full.conf

#generate a filtered configuration (like the default one) and write it to a file
.\telegraf.exe --input-filter win_perf_counters --output-filter influxdb config > telegraf_win_perf_counters.conf
Run the second command and open the generated .conf file.
There you will find lots of information about each parameter and the general rules of the conf file. Parameters that use default values may be commented (#) in the conf file.
We will have a look at the main and useful parameters, (I will remove/rewrite some comments in the code samples)
Collection Frequency
[agent]
  ## Default data collection interval for all inputs - it can be overridden by single input
  interval = "10s"
  ## Rounds collection interval to 'interval', ie interval = 10s always collect on :00, :10, :20 ...
  round_interval = true
  ## Output batch size, how many points (or "rows") are sent in each batch
  metric_batch_size = 1000
  ## Maximum number of unwritten metrics per output. If the limit is reached the oldest data will be lost
  metric_buffer_limit = 10000
  ## Add a random offset (between the given value) to the data collection, used to avoid read spikes
  collection_jitter = "0s"
  ## How often the gathered data are written to the output
  flush_interval = "10s"
  ## Wait a random delay (between the given value) before writing, used to avoid write spikes
  flush_jitter = "0s"
Adjust the values based on your requirements, for this sample i will leave them with the default value
Logging
  ## Log only error level messages.
    quiet = false

  ## Log file name, the empty string means to log to stderr.
    logfile = "C:\\Projects\\monitoring_sample\\telegraf\\log\\telegraf_win_perf_counters.log"
  ## Log rotation rule
    logfile_rotation_interval = "14d"
I want to log all the errors to a log file, and keep 14 days of log.
To successfully write the log the user running Telegraf must have the write permission to the log folder and files.
I will keep the log files in a subfolder called “log”, in a file with the name that recalls his corresponding configuration
telegraf
    │   telegraf.exe
    │   telegraf_win_perf_counters.conf
    │
    └───log
            telegraf_win_perf_counters.log
Telegraf Output and InfluxDB Configuration
The chosen output is InfluxDB and in the telegraf output settings there are several options to set in order to properly configure it.
We will write to the InfluxDB instance created in the previous post.
[[outputs.influxdb]]
  urls = ["http://127.0.0.1:8086"]
  database = "windows_system_monitor"
  skip_database_creation = true
  ## Empty retention_polic will writeto the database default retention policy
  retention_policy = "autogen"
  ## HTTP Basic Auth
  username = "telegraf"
  password = "telegraf"
With the above setting I will write to the local influxDB instance, which is running on port 8086.
If the database user used by Telegraf has the right permissions it can create the database automatically, which is not something I want.
Before running Telegraf we will create a new database in the InfluxDB instance, and a “telegraf” write only user.
Important: the credentials written in the conf file are in clear text, use system variables in serious environment (check the docs)
Configure InfluxDB
The first step is connect to InfluxDB, I will use the cli by running infux.exe, then we will create database and users using InfluxQL.
#Log-In
AUTH

#check if the authentication has been successful
SHOW USERS

#connect to database _internal, to run commands (even create db) you must connect to a DB first
USE _internal

# Create the database "windows_system_monitor"
# With a default retention policy of 30 days, no replication (only used in cluster)
# and shard duration of 1 day, which is a suggested value (details about this are out of scope)
# since non name has been specified for the retention policy it will be called "autogen"
CREATE DATABASE "windows_system_monitor" WITH DURATION 30d REPLICATION 1 SHARD DURATION 1d

# view created db and retention policy
SHOW DATABASES
SHOW RETENTION POLICIES ON windows_system_monitor

# create user
CREATE USER telegraf WITH PASSWORD 'telegraf'
# assign write privilege - available privileges are read | write | all
GRANT WRITE ON windows_system_monitor TO telegraf

# check the created user
SHOW USERS
SHOW GRANTS FOR telegraf

# close connection
EXIT
Now we can go back to the Telegraf configuration and check that the values of the parameters correspond with the created db and user.
For the complete reference of InfluxQL see the docs
Testing the Configuration
It is possible to test the configuration, this will show us what Telegraf will gather and send, but without actually writing to the output.
# run the test
.\telegraf.exe --config .\telegraf_win_perf_counters.conf --test

# this should be the output
2019-11-15T14:01:14Z I! Starting Telegraf 1.12.5
> win_cpu,host=QDLP03,instance=3,objectname=Processor Percent_DPC_Time=0,Percent_Idle_Time=99.06145477294922,Percent_Interrupt_Time=0,Percent_Privileged_Time=1.528722882270813,Percent_Processor_Time=2.161736488342285,Percent_User_Time=0 1573826476000000000
> win_cpu,host=QDLP03,instance=6,objectname=Processor Percent_DPC_Time=0,Percent_Idle_Time=97.84146118164062,Percent_Interrupt_Time=0,Percent_Privileged_Time=0,Percent_Processor_Time=0.6330135464668274,Percent_User_Time=0 1573826476000000000
{... and a lot more ...}
Common Error
Error running agent: Error parsing .\<FileName>.conf, line 1: invalid TOML syntax
This error is caused by the .conf file encoding (in my case Windows creates UTF-16 encoded files), please ensure that the file is saved with the UTF8 encoding and try again
Run Telegraf as a Service
The only thing left is run Telegraf as a service.
To do so you can use our friend nssm, but Telegraf can do this himself with the following command (run as admin required, otherwise the command will fail)
Important:
– Run the command from a PowerShell or cmd with as an admin
– use the absolute path to the config file, otherwise you will get error #1067 when starting the service (you can see them in Event Viewer)
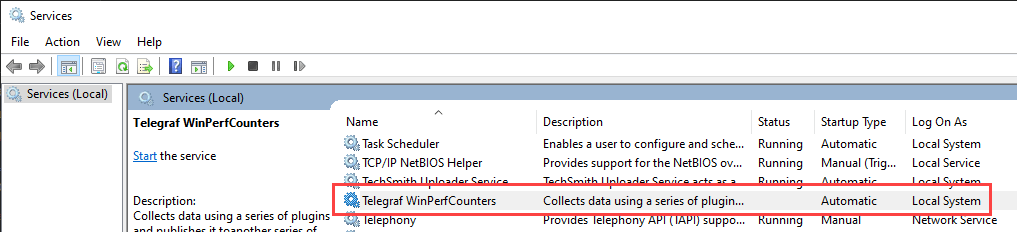
telegraf --service install --service-name=telegraf_wpc --service-display-name="Telegraf WinPerfCounters" --config "C:\Projects\monitoring_sample\telegraf\telegraf_win_perf_counters.conf"The chosen name is not the best one since the same Telegraf service can run several configuration file at once (ancd each file may contain different inputs), but for now this will do.
Now you should find “Telegraf WinPerfCounters” in the windows services
Check the Data
To check if the data collection is going well connect to InfluxDb and run the following commands
SHOW DATABASES

USE windows_system_monitor
# a measurement can be the equivalent of a table in a relational db
SHOW MEASUREMENTS

#you should see this output, that means that the metrics have been written to the db
name: measurements
name
----
win_cpu
win_disk
win_diskio
win_mem
win_net
win_swap
win_system
Full documentation about the schema navigation can be found in the docs
The End
Now Telegraf should be up and running, filling your InfluxDB with Data.
I hope you found this post useful.
