
In the previous posts we have installed an InfluxDB instance and started gathering data with Telegraf, now we want to explore and query those data.
- A Brief Introduction
- Download Chronograf
- Run Chronograf
- Chronograf UI Overview
- InfluxDB Schema vs SQL DB Schema
- Authentication
- Run Chronograf as a Service
A Brief Introduction
To query the data you can use the InfluxQL or Flux languages through the cli or http but there is a better way to explore your data, Chronograf
Chronograf is the GUI of the TICK stack, it allows you to manage InfluxDB and Kapacitor, it cannot do everything, for some tasks you still need to write some code but it helps a lot, especially for data exploration, as it allows you to query and visualize the result through charts.
Download Chronograf
As every other component of the TICK stack you can download Chronograf at the following link, the current stable version is 1.7.14

Download the Windows binaries and move them to another folder, I will create a “chronograf” folder in the same directory as the previously installed TICK stack components.
The folder should contain two files
monitoring_sample
├───chronograf
│       chronoctl.exe
│       chronograf.exe
Run Chronograf
Chronograf does not have a configuration file, if you need to change something you need to use the command line options, I will use the default configuration.
To run Chronograf just execute “chronograf.exe”
# you should see something similar in the console that runs Chronograf
time="2019-11-18T10:24:18+01:00" level=info msg="Running migration 59b0cda4fc7909ff84ee5c4f9cb4b655b6a26620"
time="2019-11-18T10:24:18+01:00" level=info msg="Serving chronograf at http://[::]:8888" component=server
time="2019-11-18T10:24:18+01:00" level=info msg="Reporting usage stats" component=usage freq=24h reporting_addr="https://usage.influxdata.com" stats="os,arch,version,cluster_id,uptime"
By default Chronograf will listen on port 8888 from any host, so head to http://localhost:8888/ and be welcomed by a series of pages, which guide you in the configuration.
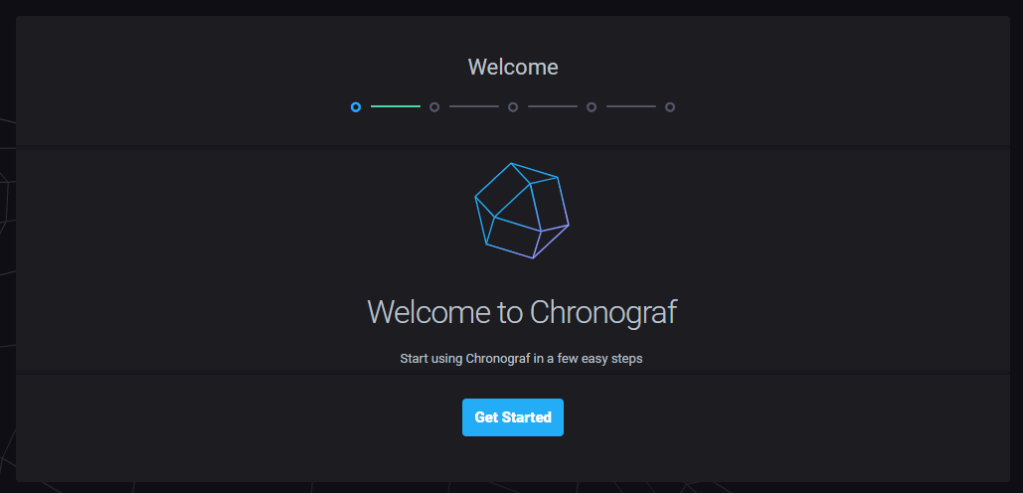
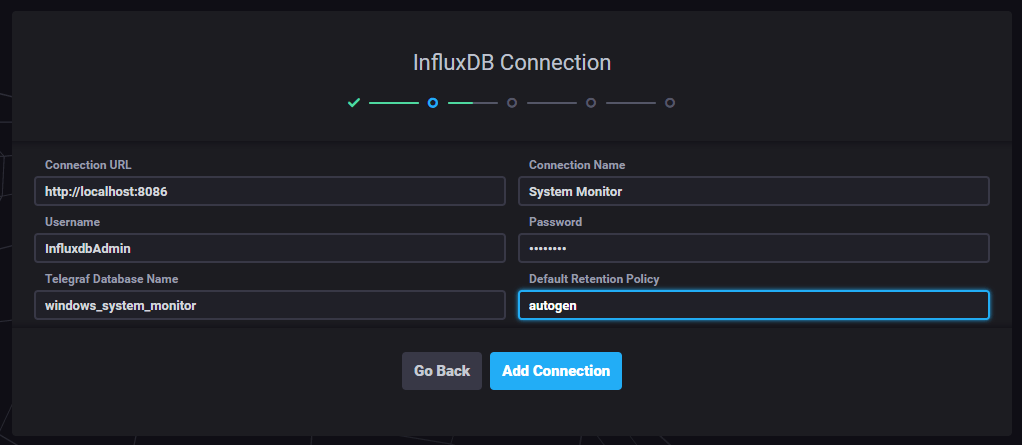
Configure the connection to InfluxDB, connect with an administrator user to be able to perform administration tasks (i.e. create databases, users, etc).
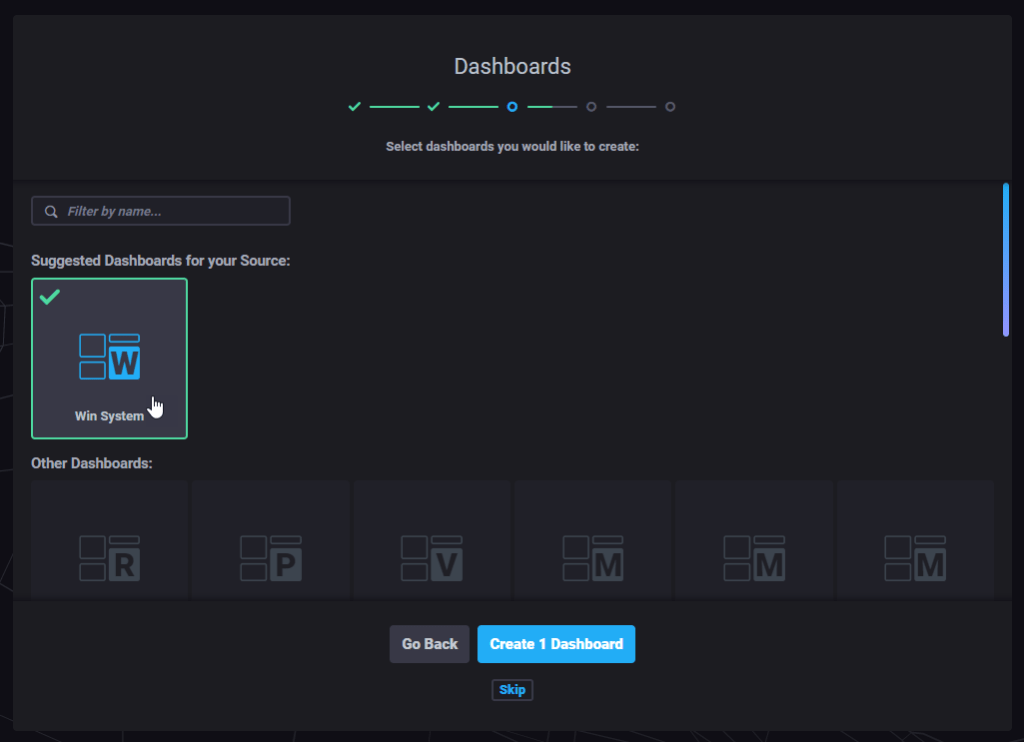
Chronograf embeds some predefined monitoring dashboards (also called “canned dashboards”), he will propose you dashboards according to the data stored in the instance.
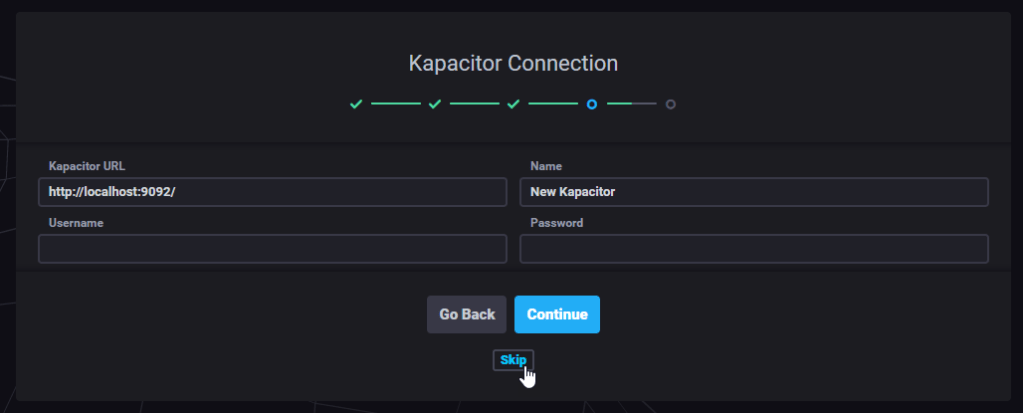
Kapacitor is the last component of the TICK stack, used to create and manage alerts, since we don’t have a Kapacitor instance yet we will skip this part.
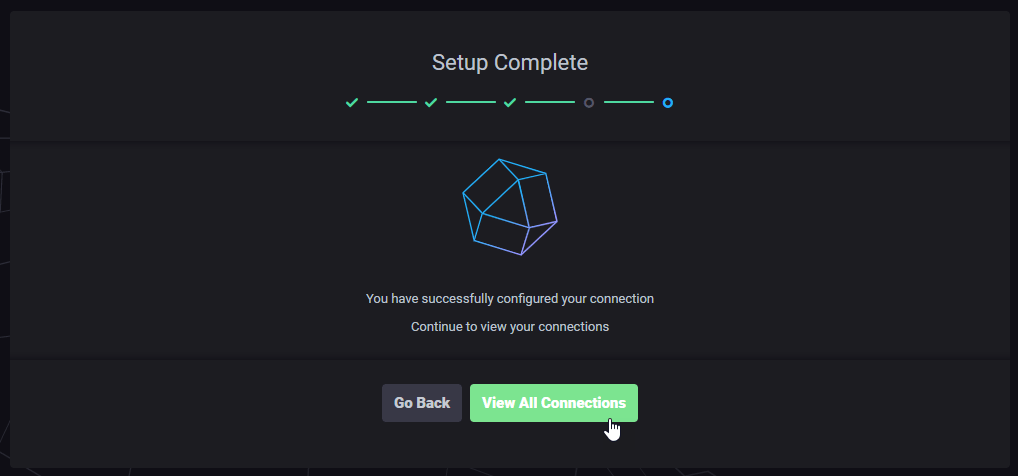
It’s done, Chronograf is up and running
Chronograf UI Overview
We will now see the main section of Chronograf regarding InfluxDB, some pages are strictly related to Kapacitor, which is not yet installed.
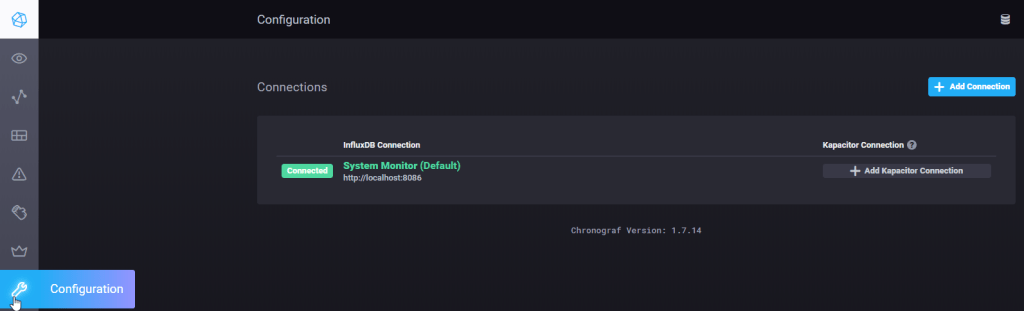
This should be the first page you see, from the “Configuration” page you can create new connections to other InfluxDB instances and link Kapacitor to those instances.
From the “InfluxDB Admin” page you can manage databases and users (create, drop, edit, manage permissions, etc). You can also view running queries.

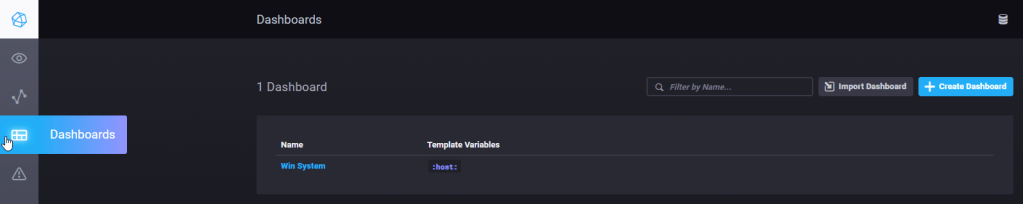
In the “Dashboards” page you can manage, view, create or import dashboards, each dashboard is a json file.
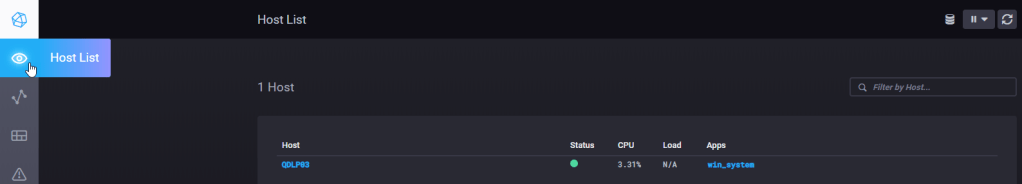
In the “Host List” page you have an overview of all the monitored hosts, with some metrics and link and to the “canned dashboards” (if installed).
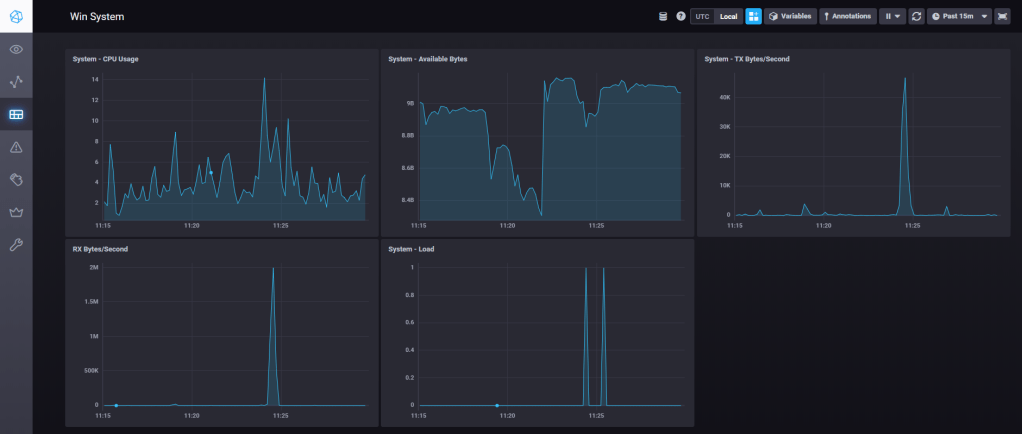
At last the best part of Chronograf (at least IMO), the “Explore” page.
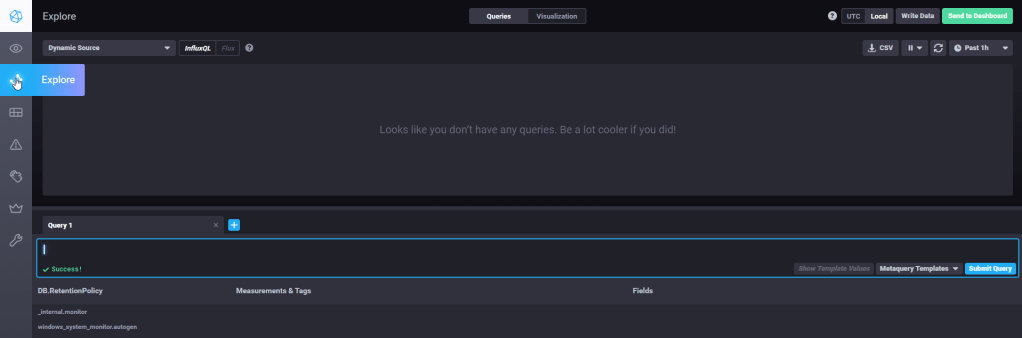
From this page you can query and visualize your data in charts, any created visualization can be saved to a dashboard.
Below an example:
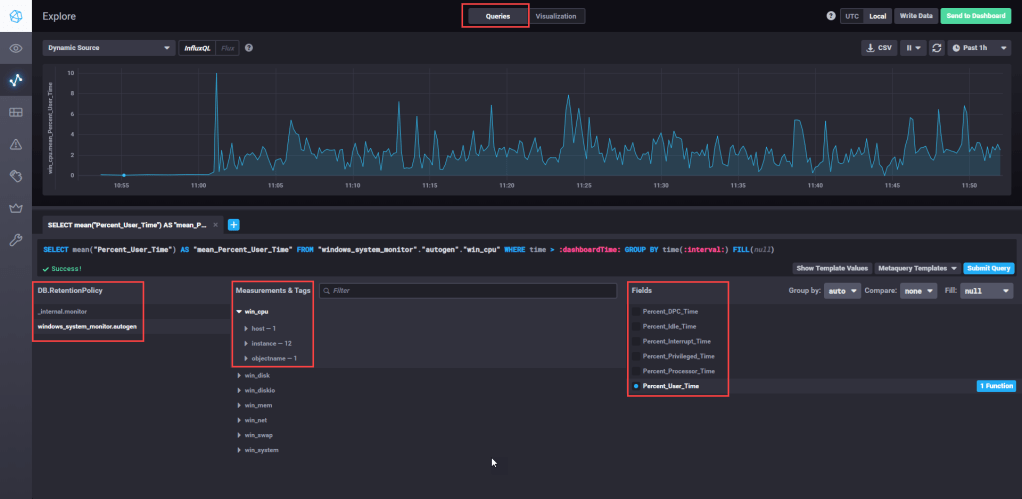
In the “Queries” section you can write a query, by hand or through the UI.
In order to create a valid query you must select at least:
- Database and Retention Policy – you can have more retention policies per db
- Measurement
- Tag – (optional) you can filter and/or group by the result by tag
- Field – with an aggregation function
The above chart uses the following query
SELECT mean("Percent_User_Time") AS "mean_Percent_User_Time" FROM "windows_system_monitor"."autogen"."win_cpu" WHERE time > :dashboardTime: AND "host"='QDLP03' GROUP BY time(:interval:) FILL(null)As you can see the result is grouped by “time(:interval:)”, which is a variable (called template variable), that can be set in the top right corner, by default it should be “1h”, so we see the last hour of data.
On the other section, “Visualization“, we can chose the visualization type and several formatting options (title, colors, axis, etc)

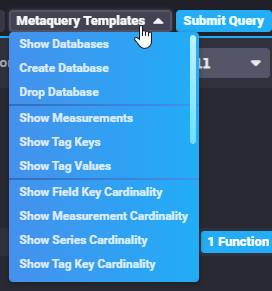
From the “Queries” section is also possible to use the “metaquery template”, which allows you to explore the influx schema.
InfluxDB Schema vs SQL DB Schema
You might be wondering what measures, tag and fields are, here you can find the full documentation, I will make only a basic summary of the main entities.
| Influx DB entity | SQL DB entity |
| Measurements | Tables |
| Tags | Columns (indexed) |
| Fields | Columns (not indexed) |
| Points | Rows |
It is important to understand the difference between Tags and Fields.
- Tags are indexed, and are used to filter and aggregate data, they provide the context for in which Fields are analyzed (i.e. view CPU usage (the Field) by host or for a specific core (the context)
- Fields are not indexed and should only be aggregated, a field should represent a metric. (i.e. CPU usage)
Authentication
As you might have noticed Chronograf by default does not ask for any username or password and therefore anyone can enter.
In this guide I won’t setup any authentication, but it is recommended to do so in any meaningful environment.
Chronograf uses Oauth 2.0, the configuration differs for each authentication provider, the full documentation can be found here.
Run Chronograf as a Service
To run Chronograf as a service we will use nssm, the setup is really simple.
Run the following command (run as admin):
.\nssm.exe installThen configure the service
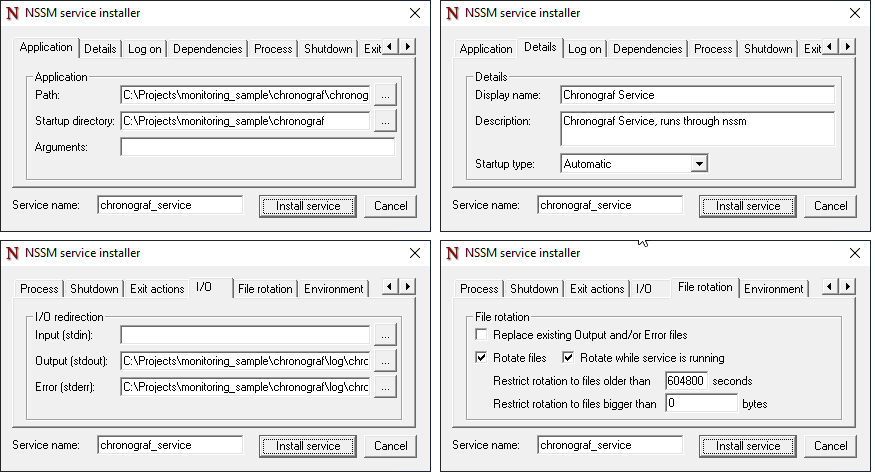
Note that I have also configured the logging, as you may have noticed all the activity performed on chronograf is sent to the console, through nssm the output is redirected to the log file.
For the log file I have created the subfolder “log” within the “chronograf” directory.
After installing the service you should find it in Windows services.
note: if you run chronograf as a specific domain user ensure that it has the rights to write the file
The End
Now you have Chronograf up and running, in one of the next post we will see another tool to create dashboards, Grafana, which is not part of the TICK stack but offers a nice set of feature regarding data visualization.
