
In this post we will see how to configure and run Kapacitor, which is the last component of the TICK stack.
- A Brief Introduction
- Download Kapacitor
- Configure and Run Kapacitor (as a Service)
- Using Kapacitor in Chronograf
- Add a Kapacitor Connection
- Add Handlers
- Create an Alert Task
A Brief Introduction
Kapacitor is a data processing engine for InfluxDB, which can process streaming and batch data.
Kapacitor has his own programming language, the TICK Script, that’s used to create rules and manage actions. i.e. you can create a rule that does the following:
if the metric <x> is over the threshold <y> for <n> seconds then we are at <warning|critical> level, <do something> and send an alert to <handler|topic>
Kapacitor can interact with other systems using User Defined Functions, and offer built in outputs like SMTP, log files, http post, Slack, Telegram and lots of other services.
The alerts can be managed in two ways:
- Push to handler – that means “send the alert via <handler (SMTP and others)>”
- Publish and subscribe – which means that the alerts are sent to one or more “topic” and then the handlers can subscribe to that topic.
Download Kapacitor
Kapacitor can be downloaded from the InfluxData website at the following link: https://portal.influxdata.com/downloads/
In this guide, I will use Kapacitor version 1.5.3 which is the current stable version.

I will extract the files to a folder called “kapacitor”, this should be the content of the zip
kapacitor
    kapacitor.conf
    kapacitor.exe
    kapacitord.exe
    tickfmt.exe
Configure and Run Kapacitor (as a Service)
As every other component of the TICK stack capacitor runs with a configuration file, a documented sample files comes with the downloaded archive.
The full documentation can be found here.
To create a new one run the following command:
.\kapacitord.exe config > kapacitor_custom.confImportant Note: if you create the file using Powershell (as I do), Kapacitor won’t be able to parse the file because it’s encoded in UTF-16. Ensure that the conf File is encoded in UTF-8 (Without BOM).
Configuration Settings
The most important configurations are the following:
# Multiple InfluxDB configurations can be defined. Each one will be given a name and can be referenced in queries
# only one must be marked as default
# if authentication is enabled you must provide username and password
# the provided user must be an admin to be able to create the kapacitor database
# if the database exists then the user needs read and write permission
[[influxdb]]
  enabled = true
  name = "localhost"
  default = true
  urls = ["http://localhost:8086"]
  username = "InfluxdbAdmin"
  password = "password"
  # Subscription mode is either "cluster" or "server"
  subscription-mode = "server"
  subscription-protocol = "http"
  # How often kapacitor will look and subscribe to newly created databases
  subscriptions-sync-interval = "1m0s"

  # Database and retention to exclude from subscription, format: db_name = <list of retention policies>
  # by default the kapacitor db is excluded, see [stats] section
  [influxdb.excluded-subscriptions]
    _kapacitor = ["autogen"]

# send kapacitor statistics (i.e. alert messages) to the following influx database
[stats]
  enabled = true
  stats-interval = "10s"
  database = "_kapacitor"
retention-policy= "autogen"Note: configuration values might be passed using environment variables like KAPACITOR_INFLUXDB_0_USERNAME=”user” and KAPACITOR_INFLUXDB_0_PASSWORD=”pw”
Other useful configuration settings are
# Kapacitor meta files location, the created conf file defaults to the user directory i.e. C:\\Users\\gluisotto\\.kapacitor
# I will put all the files in the "files" subdirectory
data_dir = "C:\\Projects\\monitoring_sample\\kapacitor\\files"

# all the other files will be written in the same subfolder
[replay]
  dir = "C:\\Projects\\monitoring_sample\\kapacitor\\files\\replay"

[storage]
  boltdb = "C:\\Projects\\monitoring_sample\\kapacitor\\files\\kapacitor.db"

# The task section is deprecated, use [load] instead
# [task]

# On startup load the tick scripts in this folder
[load]
  enabled = true
  dir = "C:\\Projects\\monitoring_sample\\kapacitor\\files\\load"


# Logging configuration, i will keep STDOUT here and write a rotated log file using nssm
[logging]
  # Can be a path to a file or 'STDOUT', 'STDERR'.
  file = "STDOUT"
  # Logging level can be one of: DEBUG, INFO, WARN, ERROR, or OFF
  level = "INFO"
Run Kapacitor as a Service
Now test the configuration file by running kapacitor, any error will be visible in the console
.\kapacitord.exe -config .\kapacitor_custom.confIf everything is working properly we can set up the service using nssm.
The process il always the same, start powershell (as admin) and execute nssm:
.\nssm.exe installAnd configure the service as you wish.
Note: The arguments parameter must contain the absolute path to the .conf file
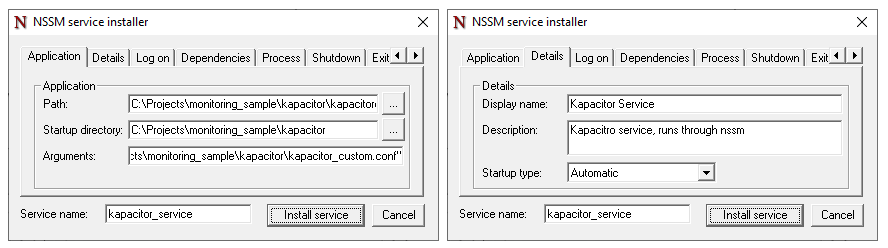
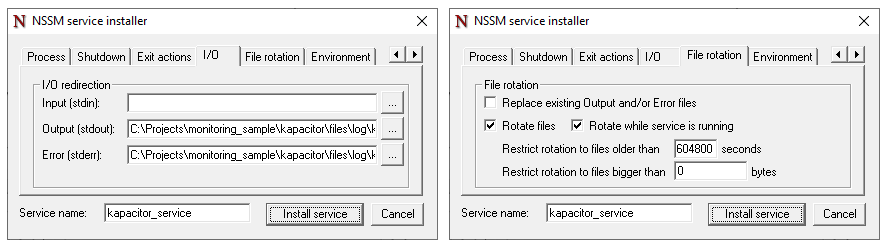
I will manage the logging through nssm, which can rotate files (folder and file should be created beforehand).
Install the service, now you should see it in “services”.
Start it, errors will be visible in the log file, service linked errors will be visible in event viewer.
Using Kapacitor in Chronograf
Capacitor has already subscribed to our InfluxDB instance and can be used through the command line (basic sample here) or from Chronograf (docs here).
In this guide I will use Chronograf, which offers an UI to manage and use Kapacitor.
Be warned that some tasks can’t be performed from the UI (like configure complex rules and other management tasks).
Add a Kapacitor Connection
The first step is to start Chronograf if it’s not already running.
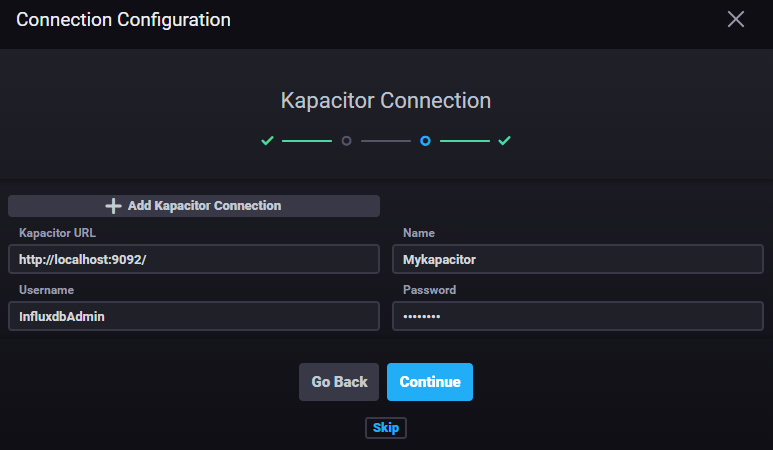
Once started go in the “configuration” section and add a Kapacitor connection.

A wizard will allow you to set up the connection, use the credentials of the InfluxDB instance.
Configure Handlers
Handlers can be configured through Chronograf or from the Kapacitor conf file.
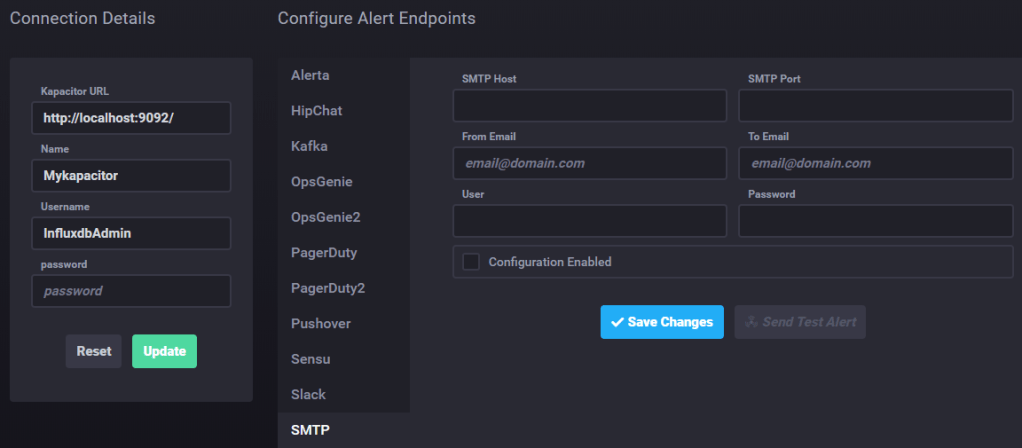
To add an Handler clock on the created Kapacitor connection and edit it.
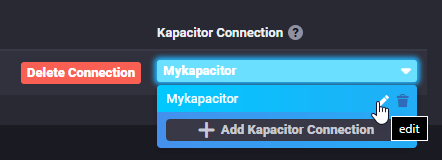
From this menu you will be able to change credentials, configure, test and enable or disable handlers, i.e. SMTP.
Some handler do not require pre-configuration, i.e. logging to a file can be configured directly in the alert rule.
Create an Alert Task
From the main page of Chronograf go to “Alerting” and select “Manage Tasks”.
From here you can create new tasks in two ways:
- Build Alert Rule – this will create a rule through the UI. which will be converted to a TICK script
- Write TICKscript – manually write a TICK script
Select “Build Alert Rule”, I will use Windows CPU data in my alert, which is configured as follows:
- Type: Threshold
- Groped by Tag: Host
- Field: mean of CPU Idle Time %
- Threshold: >= 90
Note: I use the “Idle time” so I’m sure that the rule will be triggered

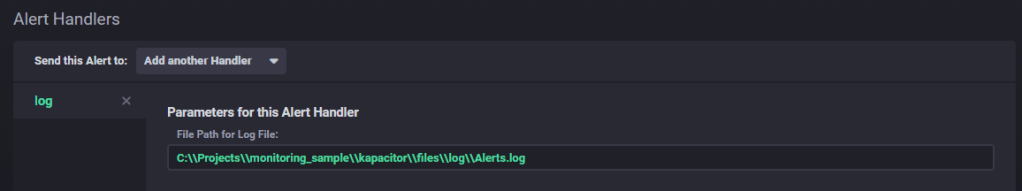
I will write the alerts to a log file but you can add as many handlers as you want (or even none). Mind the double backslash in the path.
The last step is to configure the alert message. The interface will provide some template variables, more options are available if you write the script manually.
Below the message formula:
{{.Level}} - CPU Idle Time is {{ index .Fields "value" }} on {{ index .Tags "host" }}
# note that the field key/name is "value" because that's the default alias (visible in TICKscript)
Now you can save and activate the rule.
In the “Alerting” section you will see the alert rule and it’s corresponding TICK script (which can be opened and edited).
You will see that most of what we have configured is managed through variables.
For more info about TICKscript synthax have a look at the docs
{...}
var message = '{{.Level}} - CPU Idle Time is {{ index .Fields "value" }} on {{ index .Tags "host" }}'

var idTag = 'alertID'

var levelTag = 'level'

var messageField = 'message'

var durationField = 'duration'

var outputDB = 'chronograf'

var outputRP = 'autogen'
{...}
The alert data will also be written in InfluxDB, by default the output db is called “chronograf” and the Retention Policy “Autogen”.
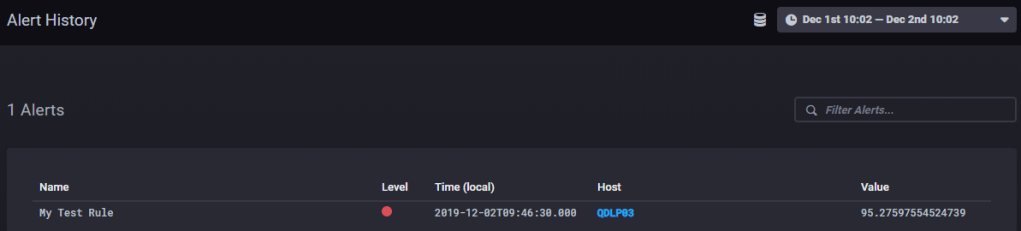
If the rule is running and the alert condition is met you should see at least one entry in “Alert History”, which shows us few information about the alert
To see the whole message we check the log file, or query the data in InfluxDB from Chronograf, use the following query to get all the data about your alert. (use the table visualization otherwise Chronograf won’t be able to show it)
SELECT * FROM "chronograf"."autogen"."alerts" WHERE alertName = 'My Test Rule'Note: the log file data are in Json format, the strings are encoded to be valid html.
Alert Summary
- Gets triggered when the idle CPU is over 90%
- The “group by Host” tells Kapacitor to send an alert for each Host that reaches the threshold, you don’t need a rule for each monitored machine, you just need to group by
- Writes a db entry when it gets triggered (critical level) and when the value gets back to a safe level (OK level)
- Alert data can be sent to handlers (in this case log) and queried on the Influx database
The End
Now you should know how to configure and run Kronograf and also have an idea about what an alert rule looks like.
I hope you found this guide simple and useful.
